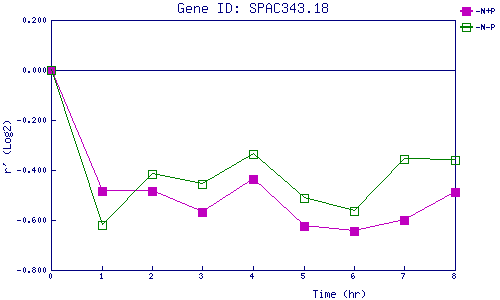
| 0 | 1 | 2 | 3 | 4 | 5 | 6 | 7 | 8 | |
| -N+P | 0.000 | -0.484 | -0.484 | -0.566 | -0.437 | -0.623 | -0.644 | -0.598 | -0.490 |
| -N-P | 0.000 | -0.620 | -0.418 | -0.458 | -0.336 | -0.510 | -0.563 | -0.357 | -0.362 |
|
-N+P: Nitrogen starved in the presence of P-factor -N-P: Nitrogen starved in the absence of P-factor |