scp3
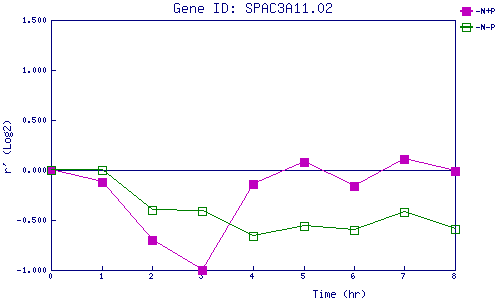
| 0 | 1 | 2 | 3 | 4 | 5 | 6 | 7 | 8 | |
| -N+P | 0.000 | -0.123 | -0.698 | -0.995 | -0.136 | 0.079 | -0.157 | 0.106 | -0.008 |
| -N-P | 0.000 | 0.004 | -0.402 | -0.413 | -0.663 | -0.557 | -0.602 | -0.420 | -0.588 |
|
-N+P: Nitrogen starved in the presence of P-factor -N-P: Nitrogen starved in the absence of P-factor |