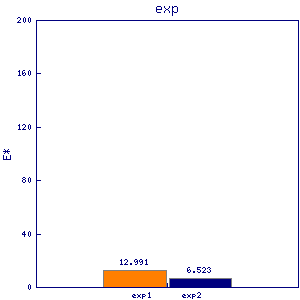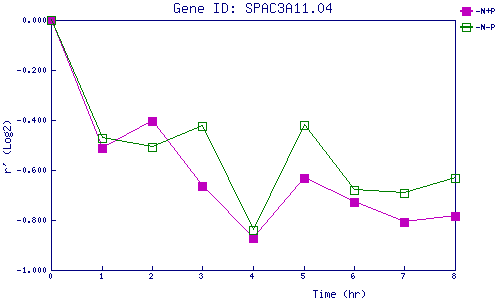
| 0 | 1 | 2 | 3 | 4 | 5 | 6 | 7 | 8 | |
| -N+P | 0.000 | -0.512 | -0.403 | -0.664 | -0.873 | -0.632 | -0.730 | -0.809 | -0.786 |
| -N-P | 0.000 | -0.471 | -0.507 | -0.422 | -0.838 | -0.419 | -0.680 | -0.691 | -0.633 |
|
-N+P: Nitrogen starved in the presence of P-factor -N-P: Nitrogen starved in the absence of P-factor |