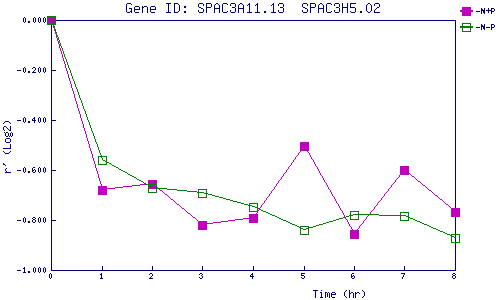
| 0 | 1 | 2 | 3 | 4 | 5 | 6 | 7 | 8 | |
| -N+P | 0.000 | -0.680 | -0.655 | -0.820 | -0.793 | -0.502 | -0.856 | -0.602 | -0.766 |
| -N-P | 0.000 | -0.562 | -0.673 | -0.693 | -0.747 | -0.838 | -0.779 | -0.785 | -0.872 |
|
-N+P: Nitrogen starved in the presence of P-factor -N-P: Nitrogen starved in the absence of P-factor |