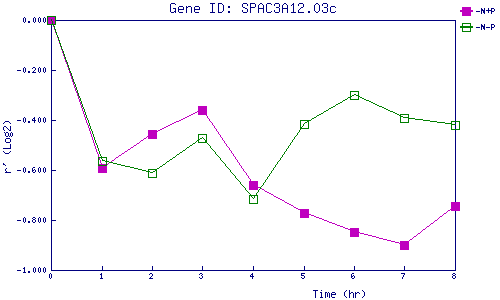
| 0 | 1 | 2 | 3 | 4 | 5 | 6 | 7 | 8 | |
| -N+P | 0.000 | -0.590 | -0.454 | -0.359 | -0.659 | -0.773 | -0.847 | -0.901 | -0.743 |
| -N-P | 0.000 | -0.564 | -0.611 | -0.473 | -0.716 | -0.418 | -0.301 | -0.391 | -0.419 |
|
-N+P: Nitrogen starved in the presence of P-factor -N-P: Nitrogen starved in the absence of P-factor |