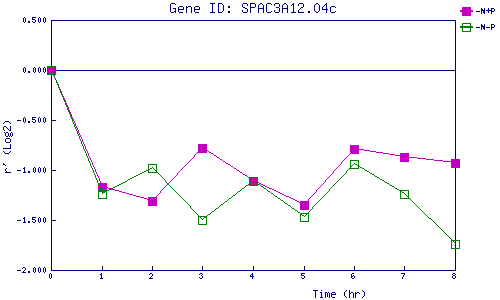
| 0 | 1 | 2 | 3 | 4 | 5 | 6 | 7 | 8 | |
| -N+P | 0.000 | -1.174 | -1.308 | -0.780 | -1.113 | -1.347 | -0.790 | -0.867 | -0.930 |
| -N-P | 0.000 | -1.241 | -0.985 | -1.497 | -1.106 | -1.466 | -0.939 | -1.239 | -1.745 |
|
-N+P: Nitrogen starved in the presence of P-factor -N-P: Nitrogen starved in the absence of P-factor |