rpb11
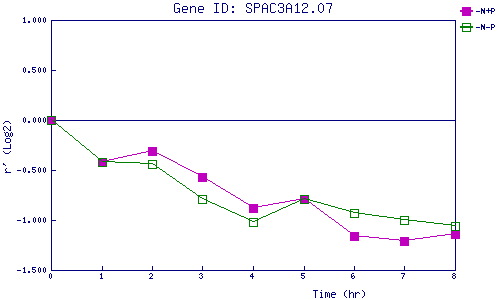
| 0 | 1 | 2 | 3 | 4 | 5 | 6 | 7 | 8 | |
| -N+P | 0.000 | -0.419 | -0.307 | -0.573 | -0.883 | -0.790 | -1.163 | -1.211 | -1.142 |
| -N-P | 0.000 | -0.422 | -0.441 | -0.788 | -1.019 | -0.787 | -0.928 | -0.996 | -1.056 |
|
-N+P: Nitrogen starved in the presence of P-factor -N-P: Nitrogen starved in the absence of P-factor |