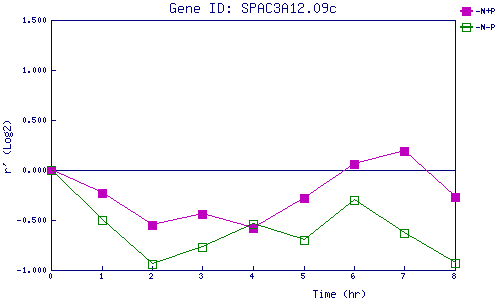
| 0 | 1 | 2 | 3 | 4 | 5 | 6 | 7 | 8 | |
| -N+P | 0.000 | -0.230 | -0.549 | -0.438 | -0.575 | -0.284 | 0.059 | 0.192 | -0.268 |
| -N-P | 0.000 | -0.502 | -0.936 | -0.773 | -0.543 | -0.700 | -0.301 | -0.632 | -0.933 |
|
-N+P: Nitrogen starved in the presence of P-factor -N-P: Nitrogen starved in the absence of P-factor |