yl17b rpl18a-2 rpl20-1 rpl2001 rpl20
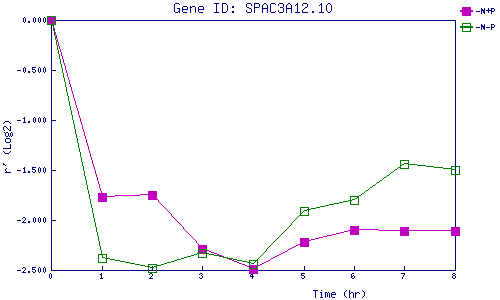
| 0 | 1 | 2 | 3 | 4 | 5 | 6 | 7 | 8 | |
| -N+P | 0.000 | -1.766 | -1.753 | -2.288 | -2.490 | -2.223 | -2.104 | -2.108 | -2.108 |
| -N-P | 0.000 | -2.382 | -2.486 | -2.328 | -2.436 | -1.912 | -1.795 | -1.445 | -1.502 |
|
-N+P: Nitrogen starved in the presence of P-factor -N-P: Nitrogen starved in the absence of P-factor |