cwf2 prp3
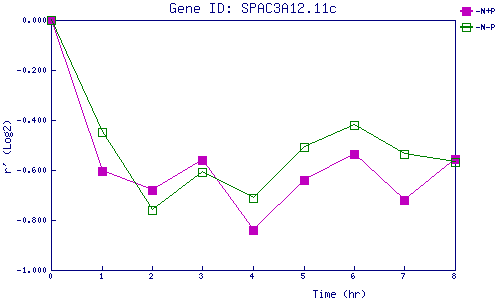
| 0 | 1 | 2 | 3 | 4 | 5 | 6 | 7 | 8 | |
| -N+P | 0.000 | -0.605 | -0.678 | -0.559 | -0.839 | -0.639 | -0.538 | -0.722 | -0.556 |
| -N-P | 0.000 | -0.446 | -0.761 | -0.606 | -0.711 | -0.509 | -0.419 | -0.536 | -0.569 |
|
-N+P: Nitrogen starved in the presence of P-factor -N-P: Nitrogen starved in the absence of P-factor |