atp11
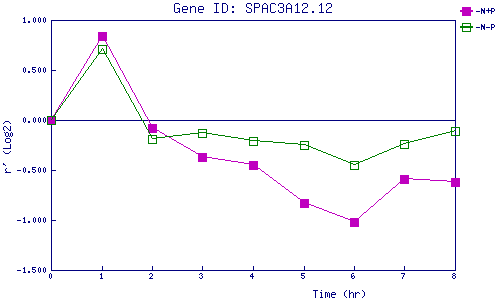
| 0 | 1 | 2 | 3 | 4 | 5 | 6 | 7 | 8 | |
| -N+P | 0.000 | 0.839 | -0.080 | -0.373 | -0.454 | -0.830 | -1.018 | -0.591 | -0.616 |
| -N-P | 0.000 | 0.707 | -0.189 | -0.127 | -0.209 | -0.251 | -0.447 | -0.244 | -0.106 |
|
-N+P: Nitrogen starved in the presence of P-factor -N-P: Nitrogen starved in the absence of P-factor |