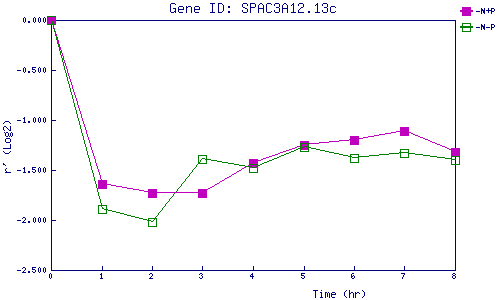
| 0 | 1 | 2 | 3 | 4 | 5 | 6 | 7 | 8 | |
| -N+P | 0.000 | -1.635 | -1.733 | -1.730 | -1.426 | -1.254 | -1.203 | -1.114 | -1.317 |
| -N-P | 0.000 | -1.892 | -2.025 | -1.388 | -1.483 | -1.273 | -1.380 | -1.328 | -1.401 |
|
-N+P: Nitrogen starved in the presence of P-factor -N-P: Nitrogen starved in the absence of P-factor |