cam1
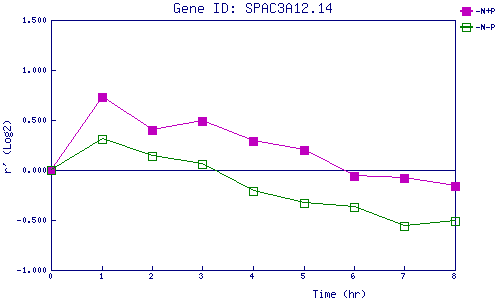
| 0 | 1 | 2 | 3 | 4 | 5 | 6 | 7 | 8 | |
| -N+P | 0.000 | 0.734 | 0.404 | 0.489 | 0.291 | 0.204 | -0.055 | -0.083 | -0.163 |
| -N-P | 0.000 | 0.313 | 0.137 | 0.060 | -0.210 | -0.326 | -0.371 | -0.560 | -0.512 |
|
-N+P: Nitrogen starved in the presence of P-factor -N-P: Nitrogen starved in the absence of P-factor |