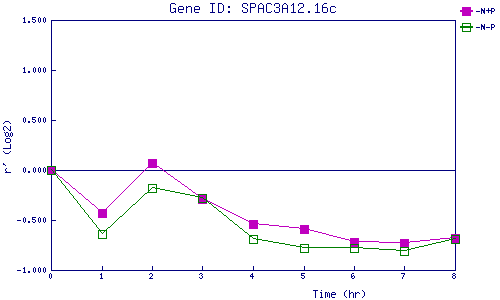
| 0 | 1 | 2 | 3 | 4 | 5 | 6 | 7 | 8 | |
| -N+P | 0.000 | -0.434 | 0.066 | -0.289 | -0.543 | -0.586 | -0.722 | -0.734 | -0.685 |
| -N-P | 0.000 | -0.644 | -0.179 | -0.278 | -0.694 | -0.783 | -0.783 | -0.814 | -0.690 |
|
-N+P: Nitrogen starved in the presence of P-factor -N-P: Nitrogen starved in the absence of P-factor |