elf1
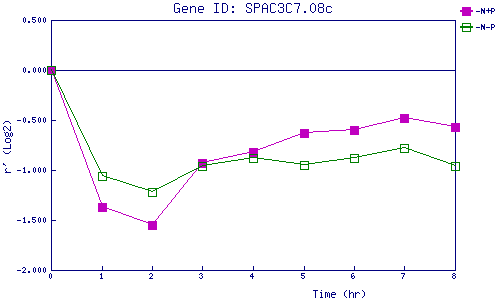
| 0 | 1 | 2 | 3 | 4 | 5 | 6 | 7 | 8 | |
| -N+P | 0.000 | -1.367 | -1.552 | -0.928 | -0.823 | -0.626 | -0.603 | -0.481 | -0.571 |
| -N-P | 0.000 | -1.055 | -1.220 | -0.955 | -0.875 | -0.951 | -0.882 | -0.784 | -0.955 |
|
-N+P: Nitrogen starved in the presence of P-factor -N-P: Nitrogen starved in the absence of P-factor |