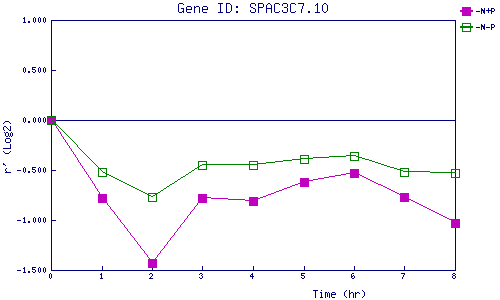
| 0 | 1 | 2 | 3 | 4 | 5 | 6 | 7 | 8 | |
| -N+P | 0.000 | -0.780 | -1.431 | -0.780 | -0.806 | -0.625 | -0.528 | -0.768 | -1.034 |
| -N-P | 0.000 | -0.523 | -0.769 | -0.447 | -0.447 | -0.388 | -0.359 | -0.524 | -0.532 |
|
-N+P: Nitrogen starved in the presence of P-factor -N-P: Nitrogen starved in the absence of P-factor |