cal1 cnx1
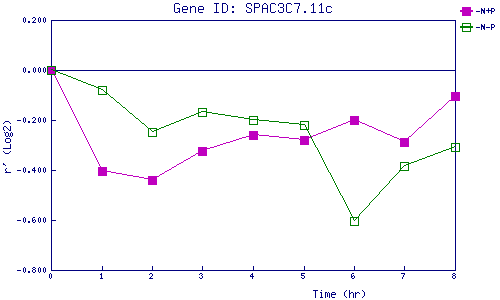
| 0 | 1 | 2 | 3 | 4 | 5 | 6 | 7 | 8 | |
| -N+P | 0.000 | -0.403 | -0.441 | -0.324 | -0.261 | -0.281 | -0.198 | -0.289 | -0.106 |
| -N-P | 0.000 | -0.082 | -0.250 | -0.166 | -0.202 | -0.221 | -0.605 | -0.382 | -0.308 |
|
-N+P: Nitrogen starved in the presence of P-factor -N-P: Nitrogen starved in the absence of P-factor |