noc1 tip1
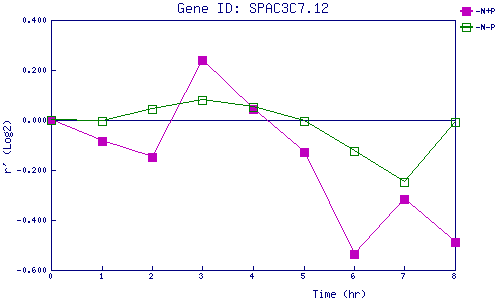
| 0 | 1 | 2 | 3 | 4 | 5 | 6 | 7 | 8 | |
| -N+P | 0.000 | -0.084 | -0.148 | 0.242 | 0.043 | -0.129 | -0.537 | -0.316 | -0.490 |
| -N-P | 0.000 | -0.005 | 0.045 | 0.082 | 0.052 | -0.005 | -0.123 | -0.246 | -0.010 |
|
-N+P: Nitrogen starved in the presence of P-factor -N-P: Nitrogen starved in the absence of P-factor |