trk1
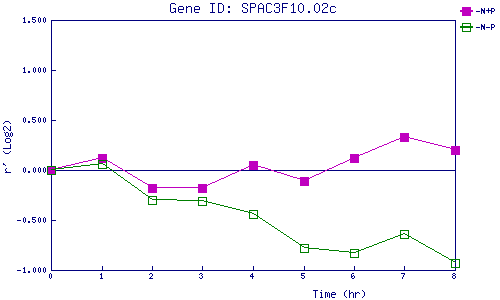
| 0 | 1 | 2 | 3 | 4 | 5 | 6 | 7 | 8 | |
| -N+P | 0.000 | 0.119 | -0.183 | -0.175 | 0.046 | -0.113 | 0.119 | 0.331 | 0.204 |
| -N-P | 0.000 | 0.059 | -0.299 | -0.308 | -0.440 | -0.778 | -0.831 | -0.642 | -0.926 |
|
-N+P: Nitrogen starved in the presence of P-factor -N-P: Nitrogen starved in the absence of P-factor |