| 0 | 1 | 2 | 3 | 4 | 5 | 6 | 7 | 8 | |
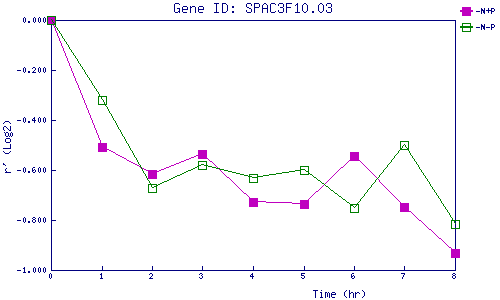
| -N+P | 0.000 | -0.508 | -0.618 | -0.537 | -0.726 | -0.734 | -0.544 | -0.749 | -0.931 |
| -N-P | 0.000 | -0.321 | -0.672 | -0.580 | -0.631 | -0.598 | -0.750 | -0.499 | -0.814 |
|
-N+P: Nitrogen starved in the presence of P-factor -N-P: Nitrogen starved in the absence of P-factor |