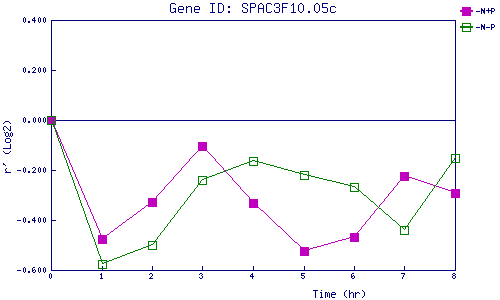
| 0 | 1 | 2 | 3 | 4 | 5 | 6 | 7 | 8 | |
| -N+P | 0.000 | -0.476 | -0.328 | -0.104 | -0.333 | -0.525 | -0.469 | -0.224 | -0.291 |
| -N-P | 0.000 | -0.576 | -0.499 | -0.240 | -0.165 | -0.221 | -0.267 | -0.439 | -0.150 |
|
-N+P: Nitrogen starved in the presence of P-factor -N-P: Nitrogen starved in the absence of P-factor |