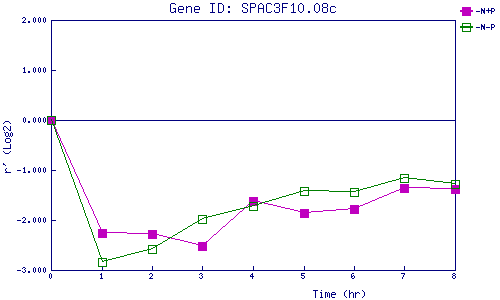
| 0 | 1 | 2 | 3 | 4 | 5 | 6 | 7 | 8 | |
| -N+P | 0.000 | -2.257 | -2.286 | -2.527 | -1.617 | -1.855 | -1.772 | -1.357 | -1.388 |
| -N-P | 0.000 | -2.850 | -2.588 | -1.984 | -1.721 | -1.414 | -1.443 | -1.157 | -1.281 |
|
-N+P: Nitrogen starved in the presence of P-factor -N-P: Nitrogen starved in the absence of P-factor |