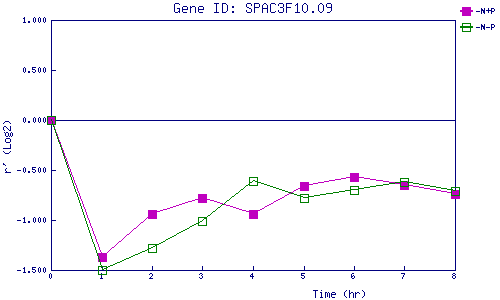
| 0 | 1 | 2 | 3 | 4 | 5 | 6 | 7 | 8 | |
| -N+P | 0.000 | -1.373 | -0.938 | -0.778 | -0.941 | -0.663 | -0.569 | -0.646 | -0.737 |
| -N-P | 0.000 | -1.495 | -1.278 | -1.011 | -0.606 | -0.775 | -0.698 | -0.616 | -0.706 |
|
-N+P: Nitrogen starved in the presence of P-factor -N-P: Nitrogen starved in the absence of P-factor |