map3
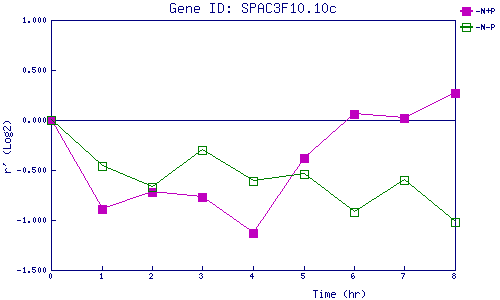
| 0 | 1 | 2 | 3 | 4 | 5 | 6 | 7 | 8 | |
| -N+P | 0.000 | -0.891 | -0.721 | -0.770 | -1.128 | -0.381 | 0.062 | 0.024 | 0.270 |
| -N-P | 0.000 | -0.459 | -0.669 | -0.298 | -0.607 | -0.542 | -0.924 | -0.604 | -1.019 |
|
-N+P: Nitrogen starved in the presence of P-factor -N-P: Nitrogen starved in the absence of P-factor |