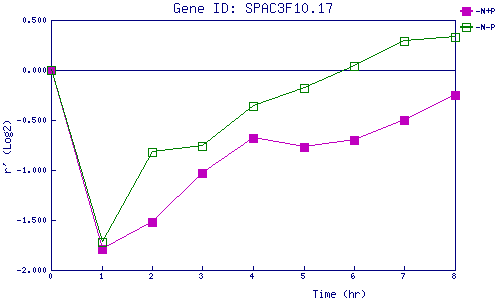
| 0 | 1 | 2 | 3 | 4 | 5 | 6 | 7 | 8 | |
| -N+P | 0.000 | -1.791 | -1.518 | -1.027 | -0.678 | -0.767 | -0.702 | -0.498 | -0.253 |
| -N-P | 0.000 | -1.717 | -0.823 | -0.761 | -0.362 | -0.185 | 0.036 | 0.291 | 0.329 |
|
-N+P: Nitrogen starved in the presence of P-factor -N-P: Nitrogen starved in the absence of P-factor |