hrp3
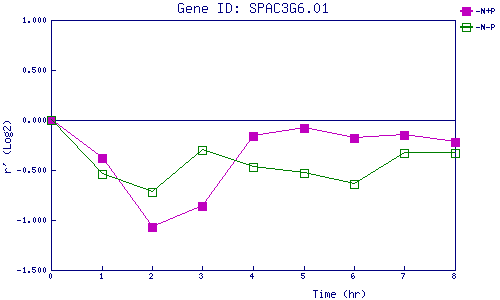
| 0 | 1 | 2 | 3 | 4 | 5 | 6 | 7 | 8 | |
| -N+P | 0.000 | -0.377 | -1.071 | -0.861 | -0.159 | -0.079 | -0.185 | -0.148 | -0.222 |
| -N-P | 0.000 | -0.535 | -0.718 | -0.299 | -0.472 | -0.529 | -0.644 | -0.328 | -0.326 |
|
-N+P: Nitrogen starved in the presence of P-factor -N-P: Nitrogen starved in the absence of P-factor |