dss1
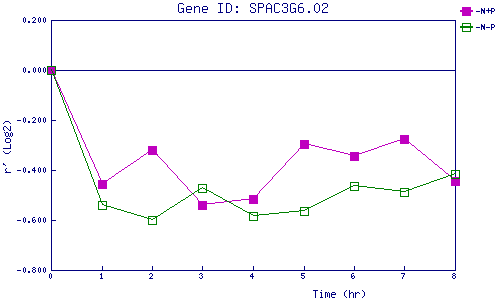
| 0 | 1 | 2 | 3 | 4 | 5 | 6 | 7 | 8 | |
| -N+P | 0.000 | -0.455 | -0.320 | -0.541 | -0.517 | -0.294 | -0.346 | -0.277 | -0.444 |
| -N-P | 0.000 | -0.539 | -0.601 | -0.474 | -0.586 | -0.563 | -0.464 | -0.486 | -0.416 |
|
-N+P: Nitrogen starved in the presence of P-factor -N-P: Nitrogen starved in the absence of P-factor |