rnp24 Sp-snR69-sno
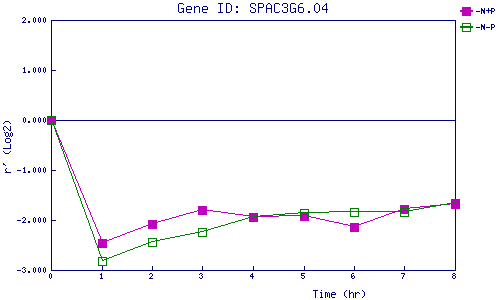
| 0 | 1 | 2 | 3 | 4 | 5 | 6 | 7 | 8 | |
| -N+P | 0.000 | -2.465 | -2.087 | -1.797 | -1.935 | -1.911 | -2.140 | -1.774 | -1.676 |
| -N-P | 0.000 | -2.824 | -2.440 | -2.235 | -1.942 | -1.854 | -1.842 | -1.837 | -1.657 |
|
-N+P: Nitrogen starved in the presence of P-factor -N-P: Nitrogen starved in the absence of P-factor |