rad2 fen1
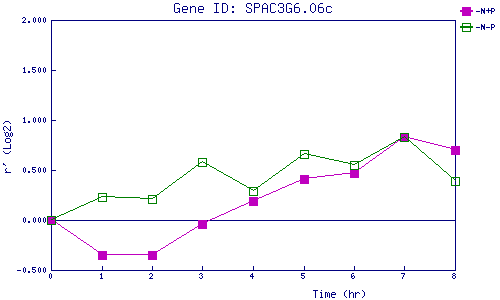
| 0 | 1 | 2 | 3 | 4 | 5 | 6 | 7 | 8 | |
| -N+P | 0.000 | -0.351 | -0.352 | -0.037 | 0.193 | 0.409 | 0.470 | 0.834 | 0.695 |
| -N-P | 0.000 | 0.234 | 0.206 | 0.580 | 0.292 | 0.657 | 0.553 | 0.826 | 0.389 |
|
-N+P: Nitrogen starved in the presence of P-factor -N-P: Nitrogen starved in the absence of P-factor |