| 0 | 1 | 2 | 3 | 4 | 5 | 6 | 7 | 8 | |
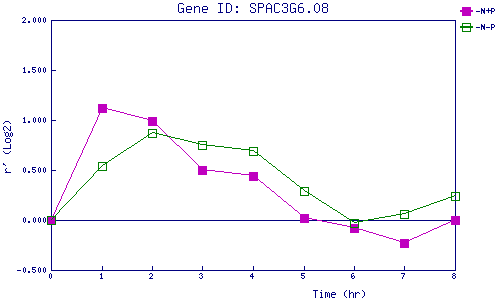
| -N+P | 0.000 | 1.119 | 0.986 | 0.502 | 0.436 | 0.025 | -0.079 | -0.229 | 0.004 |
| -N-P | 0.000 | 0.537 | 0.867 | 0.748 | 0.688 | 0.288 | -0.027 | 0.058 | 0.242 |
|
-N+P: Nitrogen starved in the presence of P-factor -N-P: Nitrogen starved in the absence of P-factor |
| Gene | ||||||||||||||||||||||||||||||
| Gene expression upon nitrogen starvation | ||||||||||||||||||||||||||||||
|
||||||||||||||||||||||||||||||
|
|
||||||||||||||||||||||||||||||
| Values plotted in the graph | ||||||||||||||||||||||||||||||
|
|
||||||||||||||||||||||||||||||
|
||||||||||||||||||||||||||||||
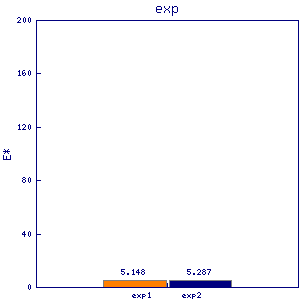
| Number of mRNA in a vegetative growing cell (estimated roughly) | ||||||||||||||||||||||||||||||
|
|
||||||||||||||||||||||||||||||
|
|
||||||||||||||||||||||||||||||