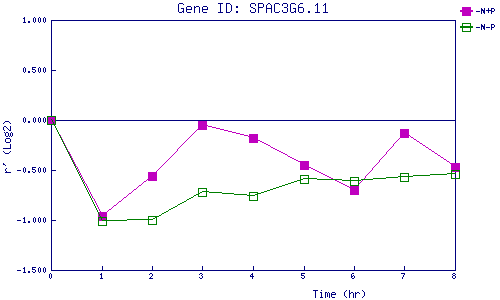
| 0 | 1 | 2 | 3 | 4 | 5 | 6 | 7 | 8 | |
| -N+P | 0.000 | -0.965 | -0.555 | -0.048 | -0.184 | -0.448 | -0.702 | -0.126 | -0.473 |
| -N-P | 0.000 | -1.015 | -0.997 | -0.724 | -0.764 | -0.587 | -0.614 | -0.570 | -0.543 |
|
-N+P: Nitrogen starved in the presence of P-factor -N-P: Nitrogen starved in the absence of P-factor |