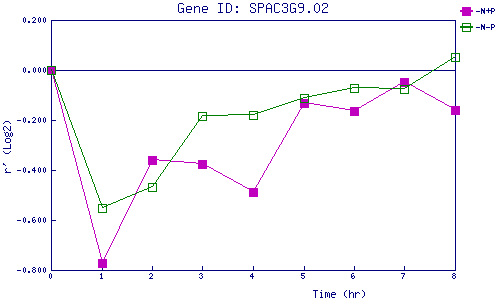
| 0 | 1 | 2 | 3 | 4 | 5 | 6 | 7 | 8 | |
| -N+P | 0.000 | -0.771 | -0.362 | -0.378 | -0.488 | -0.132 | -0.164 | -0.046 | -0.162 |
| -N-P | 0.000 | -0.551 | -0.467 | -0.185 | -0.181 | -0.110 | -0.070 | -0.077 | 0.051 |
|
-N+P: Nitrogen starved in the presence of P-factor -N-P: Nitrogen starved in the absence of P-factor |