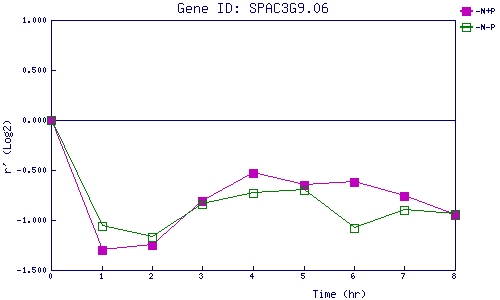
| 0 | 1 | 2 | 3 | 4 | 5 | 6 | 7 | 8 | |
| -N+P | 0.000 | -1.297 | -1.253 | -0.811 | -0.526 | -0.653 | -0.621 | -0.765 | -0.952 |
| -N-P | 0.000 | -1.064 | -1.171 | -0.838 | -0.732 | -0.695 | -1.079 | -0.900 | -0.943 |
|
-N+P: Nitrogen starved in the presence of P-factor -N-P: Nitrogen starved in the absence of P-factor |