hda1 phd1
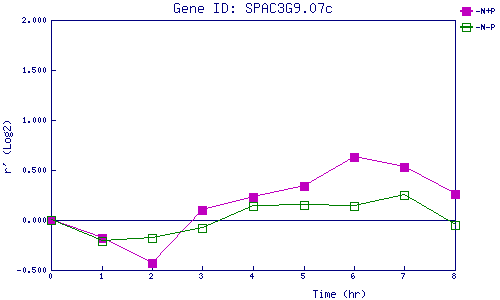
| 0 | 1 | 2 | 3 | 4 | 5 | 6 | 7 | 8 | |
| -N+P | 0.000 | -0.177 | -0.426 | 0.102 | 0.229 | 0.342 | 0.629 | 0.533 | 0.257 |
| -N-P | 0.000 | -0.214 | -0.185 | -0.085 | 0.139 | 0.146 | 0.136 | 0.246 | -0.053 |
|
-N+P: Nitrogen starved in the presence of P-factor -N-P: Nitrogen starved in the absence of P-factor |