png1
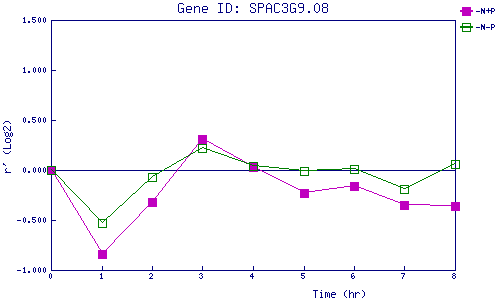
| 0 | 1 | 2 | 3 | 4 | 5 | 6 | 7 | 8 | |
| -N+P | 0.000 | -0.842 | -0.315 | 0.306 | 0.032 | -0.232 | -0.156 | -0.349 | -0.361 |
| -N-P | 0.000 | -0.529 | -0.067 | 0.224 | 0.042 | -0.006 | 0.009 | -0.190 | 0.062 |
|
-N+P: Nitrogen starved in the presence of P-factor -N-P: Nitrogen starved in the absence of P-factor |