tif211
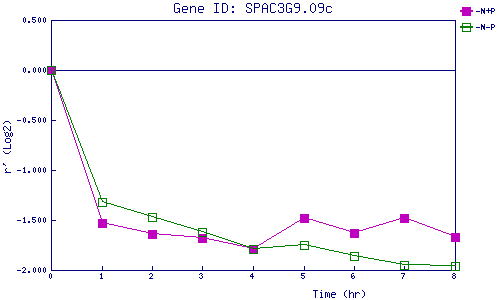
| 0 | 1 | 2 | 3 | 4 | 5 | 6 | 7 | 8 | |
| -N+P | 0.000 | -1.528 | -1.644 | -1.675 | -1.794 | -1.477 | -1.634 | -1.480 | -1.673 |
| -N-P | 0.000 | -1.317 | -1.474 | -1.623 | -1.786 | -1.747 | -1.860 | -1.951 | -1.960 |
|
-N+P: Nitrogen starved in the presence of P-factor -N-P: Nitrogen starved in the absence of P-factor |