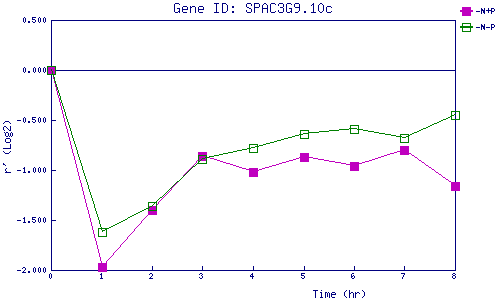
| 0 | 1 | 2 | 3 | 4 | 5 | 6 | 7 | 8 | |
| -N+P | 0.000 | -1.969 | -1.402 | -0.862 | -1.017 | -0.872 | -0.963 | -0.803 | -1.157 |
| -N-P | 0.000 | -1.619 | -1.355 | -0.886 | -0.776 | -0.635 | -0.594 | -0.684 | -0.449 |
|
-N+P: Nitrogen starved in the presence of P-factor -N-P: Nitrogen starved in the absence of P-factor |
