| 0 | 1 | 2 | 3 | 4 | 5 | 6 | 7 | 8 | |
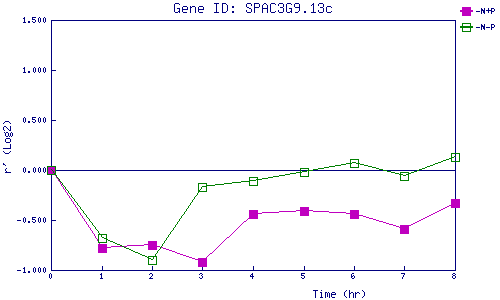
| -N+P | 0.000 | -0.783 | -0.750 | -0.922 | -0.440 | -0.406 | -0.438 | -0.589 | -0.332 |
| -N-P | 0.000 | -0.681 | -0.903 | -0.174 | -0.108 | -0.020 | 0.073 | -0.056 | 0.129 |
|
-N+P: Nitrogen starved in the presence of P-factor -N-P: Nitrogen starved in the absence of P-factor |