sak1
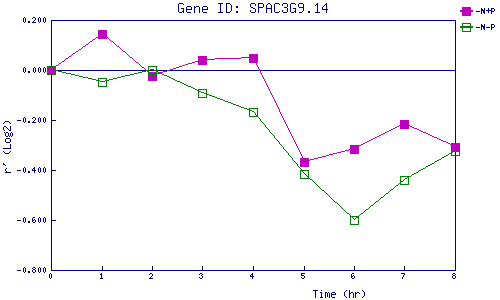
| 0 | 1 | 2 | 3 | 4 | 5 | 6 | 7 | 8 | |
| -N+P | 0.000 | 0.142 | -0.025 | 0.041 | 0.050 | -0.370 | -0.316 | -0.217 | -0.308 |
| -N-P | 0.000 | -0.050 | 0.001 | -0.093 | -0.170 | -0.415 | -0.601 | -0.442 | -0.324 |
|
-N+P: Nitrogen starved in the presence of P-factor -N-P: Nitrogen starved in the absence of P-factor |