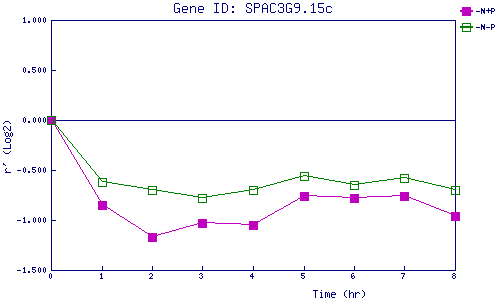
| 0 | 1 | 2 | 3 | 4 | 5 | 6 | 7 | 8 | |
| -N+P | 0.000 | -0.853 | -1.170 | -1.027 | -1.052 | -0.757 | -0.784 | -0.756 | -0.958 |
| -N-P | 0.000 | -0.623 | -0.704 | -0.776 | -0.698 | -0.563 | -0.650 | -0.585 | -0.705 |
|
-N+P: Nitrogen starved in the presence of P-factor -N-P: Nitrogen starved in the absence of P-factor |