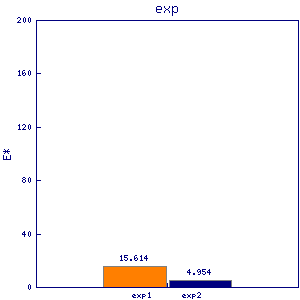
bet5
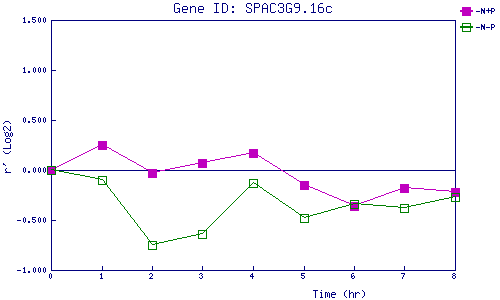
| 0 | 1 | 2 | 3 | 4 | 5 | 6 | 7 | 8 | |
| -N+P | 0.000 | 0.246 | -0.032 | 0.070 | 0.170 | -0.154 | -0.362 | -0.184 | -0.223 |
| -N-P | 0.000 | -0.104 | -0.753 | -0.636 | -0.134 | -0.475 | -0.342 | -0.385 | -0.274 |
|
-N+P: Nitrogen starved in the presence of P-factor -N-P: Nitrogen starved in the absence of P-factor |