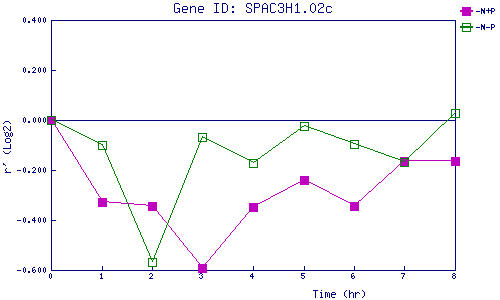
| 0 | 1 | 2 | 3 | 4 | 5 | 6 | 7 | 8 | |
| -N+P | 0.000 | -0.329 | -0.343 | -0.593 | -0.349 | -0.242 | -0.342 | -0.164 | -0.164 |
| -N-P | 0.000 | -0.101 | -0.566 | -0.068 | -0.172 | -0.022 | -0.097 | -0.167 | 0.027 |
|
-N+P: Nitrogen starved in the presence of P-factor -N-P: Nitrogen starved in the absence of P-factor |