| 0 | 1 | 2 | 3 | 4 | 5 | 6 | 7 | 8 | |
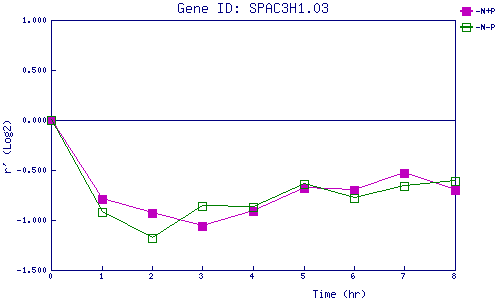
| -N+P | 0.000 | -0.792 | -0.932 | -1.055 | -0.909 | -0.677 | -0.700 | -0.528 | -0.695 |
| -N-P | 0.000 | -0.925 | -1.177 | -0.861 | -0.870 | -0.641 | -0.777 | -0.664 | -0.613 |
|
-N+P: Nitrogen starved in the presence of P-factor -N-P: Nitrogen starved in the absence of P-factor |