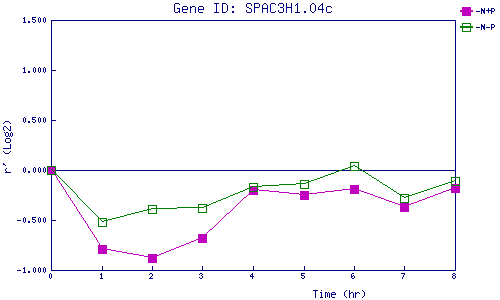
| 0 | 1 | 2 | 3 | 4 | 5 | 6 | 7 | 8 | |
| -N+P | 0.000 | -0.786 | -0.878 | -0.675 | -0.204 | -0.253 | -0.187 | -0.374 | -0.178 |
| -N-P | 0.000 | -0.522 | -0.392 | -0.376 | -0.170 | -0.142 | 0.037 | -0.279 | -0.112 |
|
-N+P: Nitrogen starved in the presence of P-factor -N-P: Nitrogen starved in the absence of P-factor |