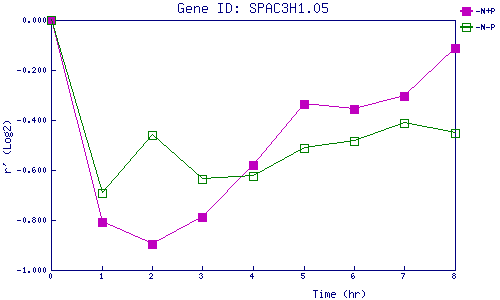
| 0 | 1 | 2 | 3 | 4 | 5 | 6 | 7 | 8 | |
| -N+P | 0.000 | -0.810 | -0.894 | -0.788 | -0.579 | -0.338 | -0.357 | -0.305 | -0.111 |
| -N-P | 0.000 | -0.693 | -0.460 | -0.636 | -0.625 | -0.512 | -0.484 | -0.411 | -0.452 |
|
-N+P: Nitrogen starved in the presence of P-factor -N-P: Nitrogen starved in the absence of P-factor |