aru1
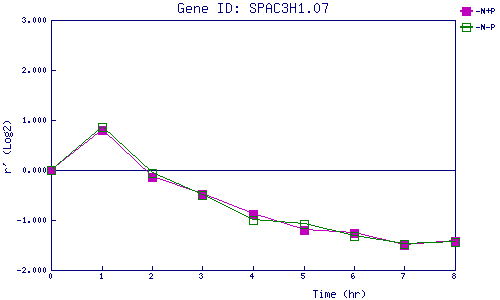
| 0 | 1 | 2 | 3 | 4 | 5 | 6 | 7 | 8 | |
| -N+P | 0.000 | 0.793 | -0.141 | -0.483 | -0.874 | -1.196 | -1.255 | -1.503 | -1.414 |
| -N-P | 0.000 | 0.868 | -0.061 | -0.509 | -1.007 | -1.073 | -1.312 | -1.490 | -1.440 |
|
-N+P: Nitrogen starved in the presence of P-factor -N-P: Nitrogen starved in the absence of P-factor |