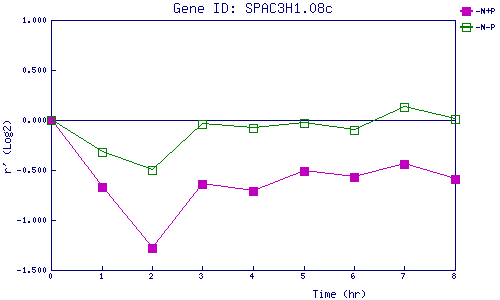
| 0 | 1 | 2 | 3 | 4 | 5 | 6 | 7 | 8 | |
| -N+P | 0.000 | -0.672 | -1.284 | -0.645 | -0.711 | -0.506 | -0.571 | -0.444 | -0.588 |
| -N-P | 0.000 | -0.318 | -0.503 | -0.041 | -0.084 | -0.034 | -0.096 | 0.132 | 0.009 |
|
-N+P: Nitrogen starved in the presence of P-factor -N-P: Nitrogen starved in the absence of P-factor |