pol1 swi7 polA
| 0 | 1 | 2 | 3 | 4 | 5 | 6 | 7 | 8 | |
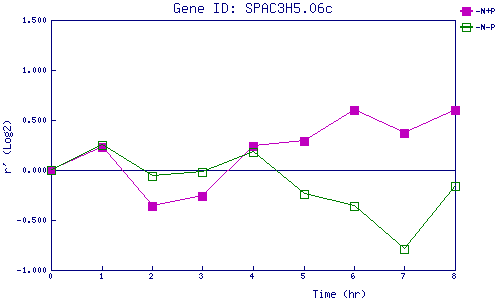
| -N+P | 0.000 | 0.234 | -0.360 | -0.260 | 0.243 | 0.289 | 0.601 | 0.367 | 0.605 |
| -N-P | 0.000 | 0.251 | -0.064 | -0.019 | 0.175 | -0.243 | -0.360 | -0.789 | -0.156 |
|
-N+P: Nitrogen starved in the presence of P-factor -N-P: Nitrogen starved in the absence of P-factor |