rpl32-2 rpl3202 rpl32
| 0 | 1 | 2 | 3 | 4 | 5 | 6 | 7 | 8 | |
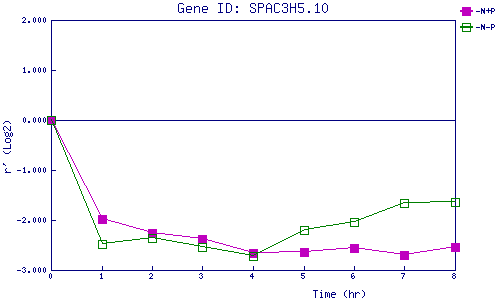
| -N+P | 0.000 | -1.976 | -2.262 | -2.385 | -2.654 | -2.646 | -2.567 | -2.691 | -2.542 |
| -N-P | 0.000 | -2.472 | -2.364 | -2.532 | -2.721 | -2.208 | -2.040 | -1.658 | -1.647 |
|
-N+P: Nitrogen starved in the presence of P-factor -N-P: Nitrogen starved in the absence of P-factor |