rpl5 rpl501 rpl5-1
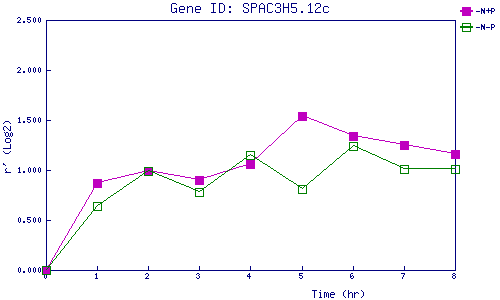
| 0 | 1 | 2 | 3 | 4 | 5 | 6 | 7 | 8 | |
| -N+P | 0.000 | 0.869 | 0.994 | 0.896 | 1.062 | 1.539 | 1.341 | 1.249 | 1.163 |
| -N-P | 0.000 | 0.642 | 0.987 | 0.776 | 1.151 | 0.814 | 1.239 | 1.013 | 1.007 |
|
-N+P: Nitrogen starved in the presence of P-factor -N-P: Nitrogen starved in the absence of P-factor |